Blackbox can be used with InfluxDB and Prometheus time-series databases to record API usage metrics. The data recorded can be visualised either by creating a custom dashboard or by using an existing dashboarding tool such as Grafana.
In addition, Blackbox logs can be searched, analyzed and monitored using Splunk. Splunk can be set up in such a way that the logs for multiple Blackbox nodes in a network are accessible from a single centralized Splunk instance.
API Metrics
Blackbox can record the following usage metrics for each endpoint of its API:
- Average Response Time
- Max Response Time
- Min Response Time
- Request Count
- Requests Per Second
These metrics can be stored in an InfluxDB or Prometheus time-series database for further analysis.
- InfluxDB should be used when it is preferred for metrics to be "pushed" from Blackbox to the DB (i.e. Blackbox starts a service which periodically writes the latest metrics to the DB by calling the DBs API)
- Prometheus should be used when it is preferred for metrics to be "pulled" from Blackbox by the DB (i.e. Blackbox exposes a
/metricsAPI endpoint which the DB periodically calls to fetch the latest metrics)
Both databases integrate well with the open source dashboard editor Grafana to allow for easy creation of dashboards to visualise the data being captured from Blackbox.
Using InfluxDB
See the InfluxDB documentation for details on how to set up an InfluxDB database ready for use with Blackbox. A summary of the steps is as follows:
- Install InfluxDB
- Start the InfluxDB serverFor local development/testing the default configuration file (Linux:
influxd -config /path/to/influx.conf/etc/influxdb/influxdb.conf, macOS:/usr/local/etc/influxdb.conf), should be sufficient. For further configuration options see Configuring InfluxDB - Connect to the InfluxDB server using the
influxCLI and create a new DB. If using the default config, this is simply:influx > CREATE DATABASE myDb - To view data stored in the database use the Influx Query Language
influx
> USE myDb
> SHOW MEASUREMENTS
> SELECT * FROM <measurement>
!!! info
The InfluxDB HTTP API can be called directly as an alternative to using the influx CLI
Each Blackbox server type (i.e. P2P, Q2T, ADMIN, THIRDPARTY, ENCLAVE) can be configured to store API metrics in an InfluxDB. These servers can be configured to store metrics to the same DB or separate ones. Not all servers need to be configured to store metrics.
To configure a server to use an InfluxDB, add influxConfig to the server config. For example:
"serverConfigs": [
    {
        "app":"Q2T",
        "enabled": true,
        "serverAddress":"unix:/path/to/tm.ipc",
        "communicationType" : "REST",
        "influxConfig": {
            "serverAddress": "https://localhost:8086",  // InfluxDB server address
            "dbName": "myDb",                           // InfluxDB DB name (DB must already exist)
            "pushIntervalInSecs": 15,                   // How frequently Blackbox will push new metrics to the DB
            "sslConfig": {                              // Config required if InfluxDB server is using TLS
                "tls": "STRICT",
                "sslConfigType": "CLIENT_ONLY",
                "clientTrustMode": "CA",
                "clientTrustStore": "/path/to/truststore.jks",
                "clientTrustStorePassword": "password",
                "clientKeyStore": "path/to/truststore.jks",
                "clientKeyStorePassword": "password"
            }
        }
    },
    {
        "app":"P2P",
        "enabled": true,
        "serverAddress":"http://localhost:9001",
        "communicationType" : "REST",
        "influxConfig": {
            "serverAddress": "http://localhost:8087",
            "dbName": "anotherDb",
            "pushIntervalInSecs": 15
        }
    }
]
InfluxDB TLS Configuration
InfluxDB supports 1-way TLS. This allows clients to validate the identity of the InfluxDB server and provides data encryption.
See Enabling HTTPS with InfluxDB for details on how to secure an InfluxDB server with TLS. A summary of the steps is as follows:
- Obtain a CA/self-signed certificate and key (either as separate
.crtand.keyfiles or as a combined.pemfile) - Enable HTTPS in
influx.conf:# Determines whether HTTPS is enabled. https-enabled = true # The SSL certificate to use when HTTPS is enabled. https-certificate = "/path/to/certAndKey.pem" # Use a separate private key location. https-private-key = "/path/to/certAndKey.pem" - Restart the InfluxDB server to apply the config changes
To allow Blackbox to communicate with a TLS-secured InfluxDB, sslConfig must be provided. To configure Blackbox as the client in 1-way TLS:
"sslConfig": {
    "tls": "STRICT",
    "sslConfigType": "CLIENT_ONLY",
    "clientTrustMode": "CA",
    "clientTrustStore": "/path/to/truststore.jks",
    "clientTrustStorePassword": "password",
    "clientKeyStore": "path/to/truststore.jks",
    "clientKeyStorePassword": "password",
    "environmentVariablePrefix": "INFLUX"
}
where truststore.jks is a Java KeyStore format file containing the trusted certificates for the Blackbox client (e.g. the certificate of the CA used to create the InfluxDB certificate).
If securing the keystore with a password this password should be provided. Passwords can be provided either in the config (e.g. clientTrustStorePassword) or as environment variables (using environmentVariablePrefix and setting <PREFIX>_Blackbox_CLIENT_TRUSTSTORE_PWD). The TLS Config documentation explains this in more detail.
As Blackbox expects 2-way TLS, a .jks file for the clientKeyStore must also be provided. This will not be used so can simply be set as the truststore.
Using Prometheus
The Prometheus documentation provides all the information needed to get Prometheus setup and ready to integrate with Blackbox. The Prometheus First Steps is a good starting point. A summary of the steps to store Blackbox metrics in a Prometheus DB are as follows:
- Install Prometheus
- Create a
prometheus.ymlconfiguration file to provide Prometheus with the necessary information to pull metrics from Blackbox. A simple Prometheus config for use with the [7nodes example network](../../../Getting Started/7Nodes) is:global: scrape_interval: 15s evaluation_interval: 15s scrape_configs: - job_name: Blackbox-7nodes static_configs: - targets: ['localhost:9001', 'localhost:9002', 'localhost:9003', 'localhost:9004', 'localhost:9005', 'localhost:9006', 'localhost:9007'] - Start Blackbox. As Blackbox always exposes the
metricsendpoint no additional configuration of Blackbox is required - Start Prometheus
prometheus --config.file=prometheus.yml - To view data stored in the database, access the Prometheus UI (by default
localhost:9090, this address can be changed inprometheus.yml) and use the Prometheus Query Language
Creating a Grafana dashboard
Grafana can be used to create dashboards from data stored in InfluxDB or Prometheus databases. See the Grafana documentation and Grafana Getting Started for details on how to set up a Grafana instance and integrate it with databases. A summary of the steps is as follows:
- Install and start Grafana as described for your OS (if using the default config, Grafana will start on port
3000and require login/passwordadmin/adminto access the dashboard) - Create a Data Source to provide the necessary details to connect to the database
- Create a new Dashboard
- Add panels to the dashboard. Panels are the graphs, tables, statistics etc. that make up a dashboard. The New Panel wizard allows the components of the panel to be configured:
- Queries: Details the query to use retrieve data from the datasource, see the following links for info on using the Query Editor for InfluxDB and Prometheus
- Visualization: How to present the data queried, including panel type, axis headings etc.
Example dashboard
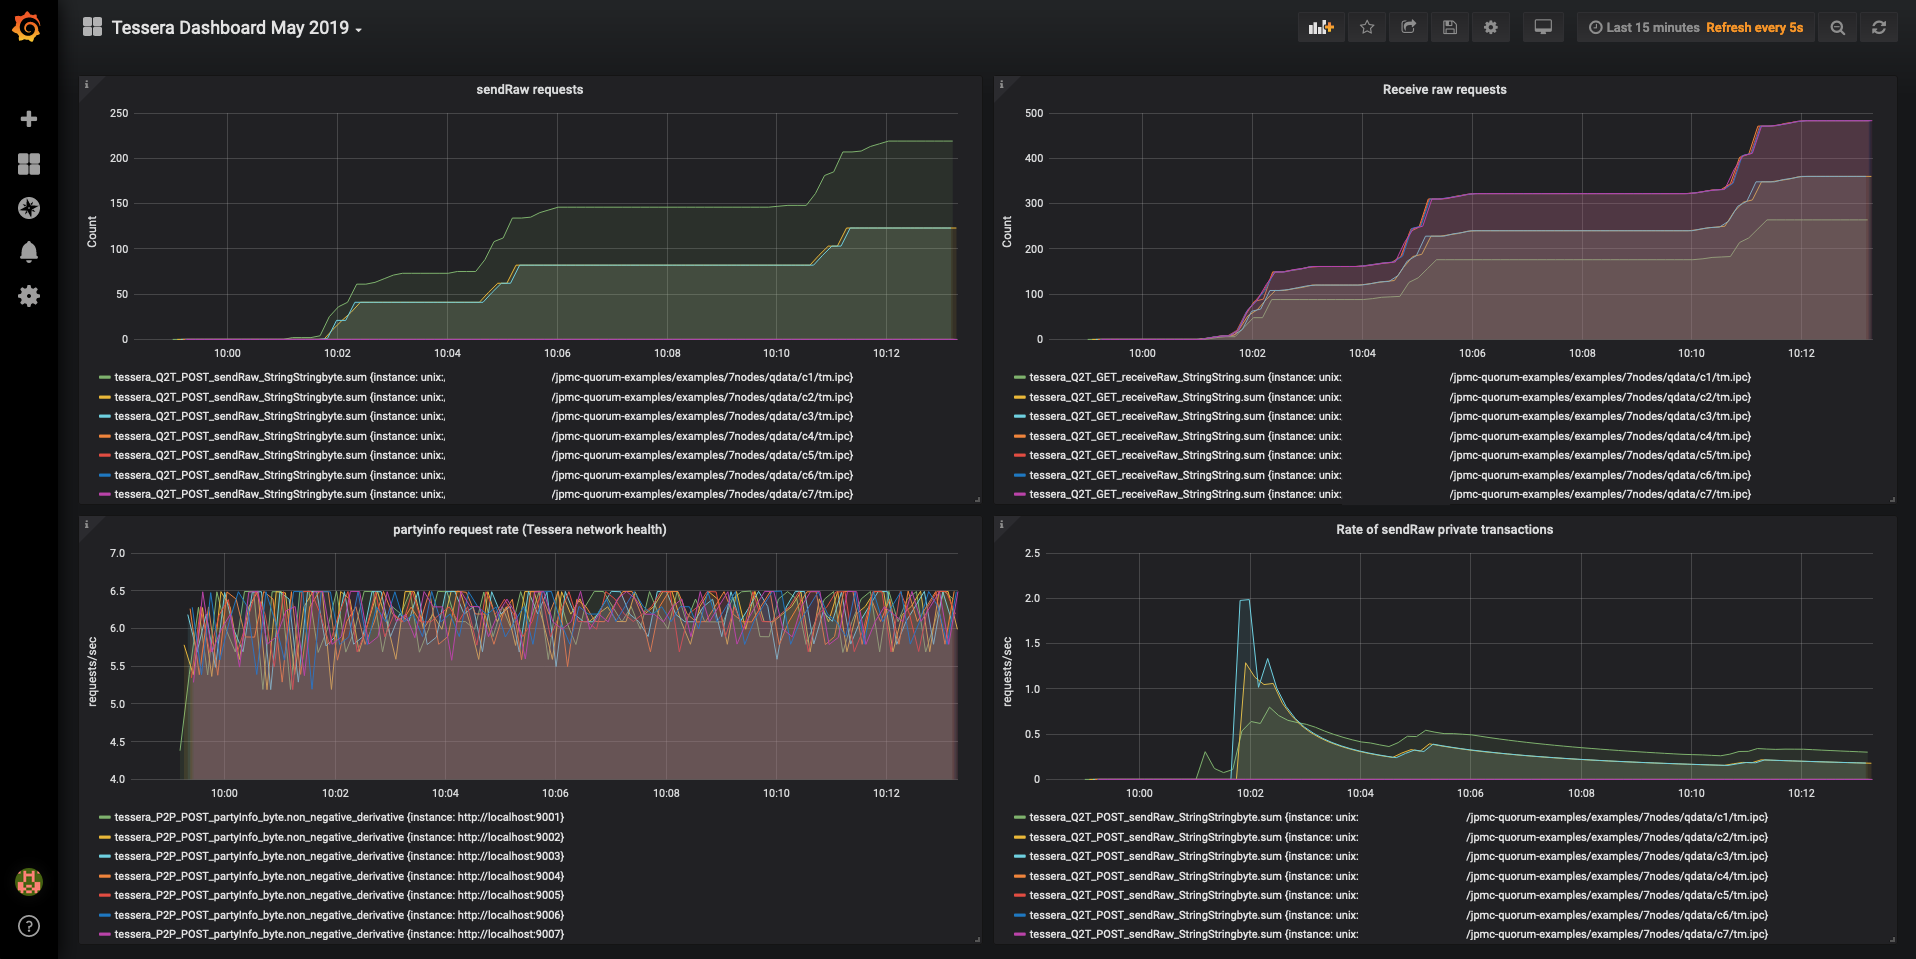
To create this dashboard, a [7nodes example network](../../../Getting Started/7Nodes) was started, with each Blackbox node configured to store its P2P and Q2T metrics to the same InfluxDB. Several runs of the Smilo Acceptance Tests were run against this network to simulate network activity.
As can be seen in the top-right corner, the dashboard was set to only show data collected in the past 15 mins.
To create a dashboard similar to this:
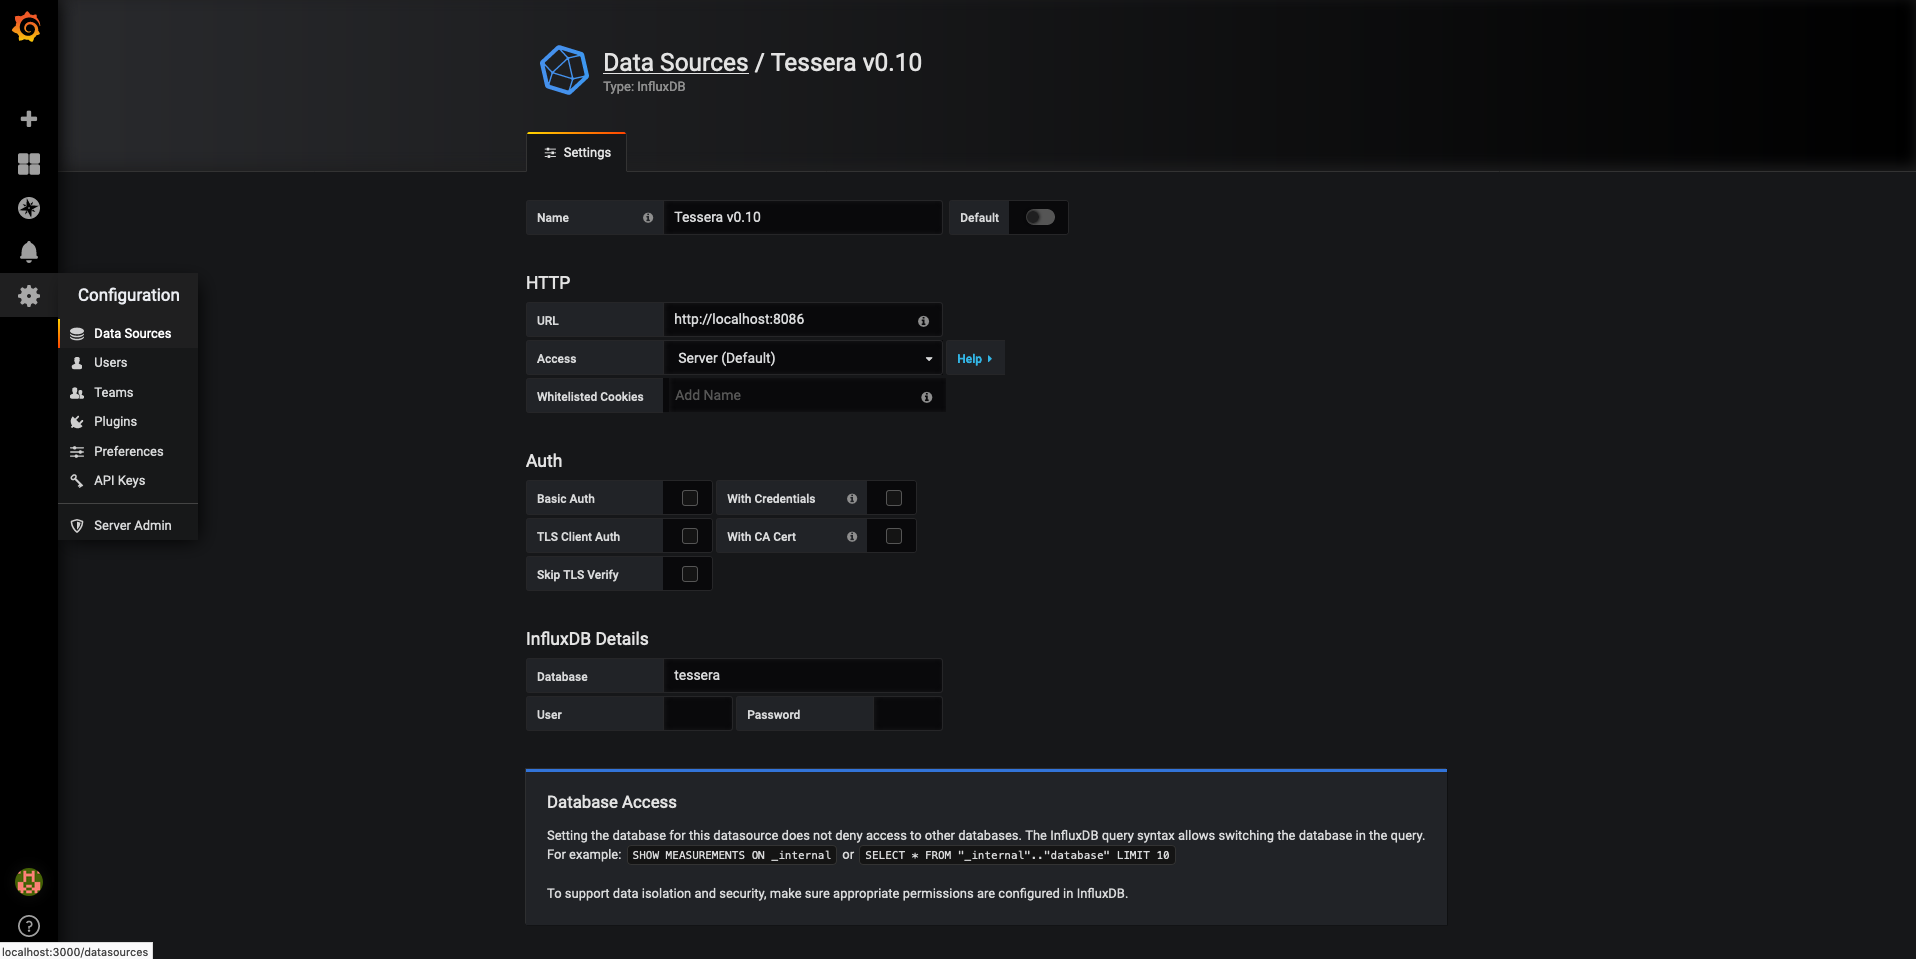
Create an InfluxDB datasource within Grafana:
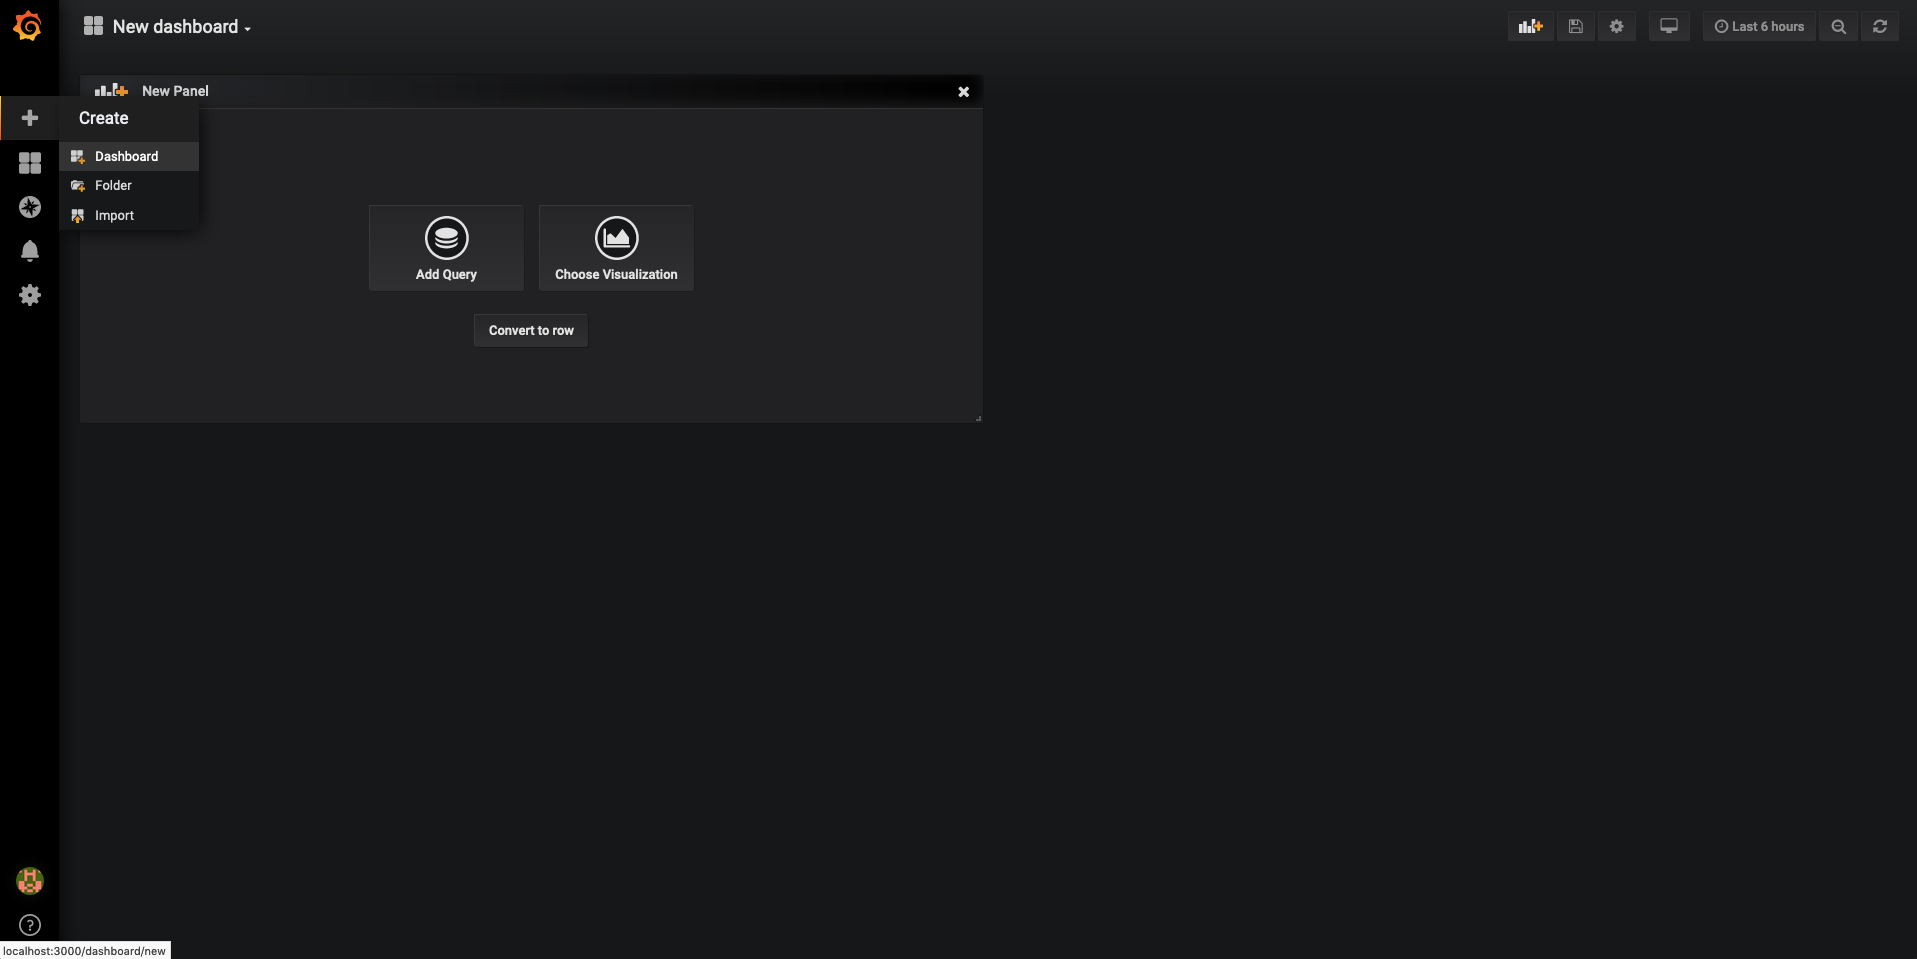
Create a new dashboard
- Hover over the plus icon in the left sidebar
- Dashboard
- Add Query to configure the first panel
- Add Panel in the top-right to add additional panels
!!! note For each of the following examples, additional options such as titles, axis labels and formatting can be configured by navigating the menus in the left-hand sidebar
[](../../../images/Blackbox/monitoring/grafana-panel-sidebar.png)Create sendRaw requests panel
- Select the correct datasource from the Queries to dropdown list
- Construct the query as shown in the below image. This retrieves the data for the
sendrawAPI from the InfluxDB, finds the sum of theRequestCountfor this data (i.e. the total number of requests) and groups byinstance(i.e. each Blackbox node).time($_interval)automatically scales the graph resolution for the time range and graph width.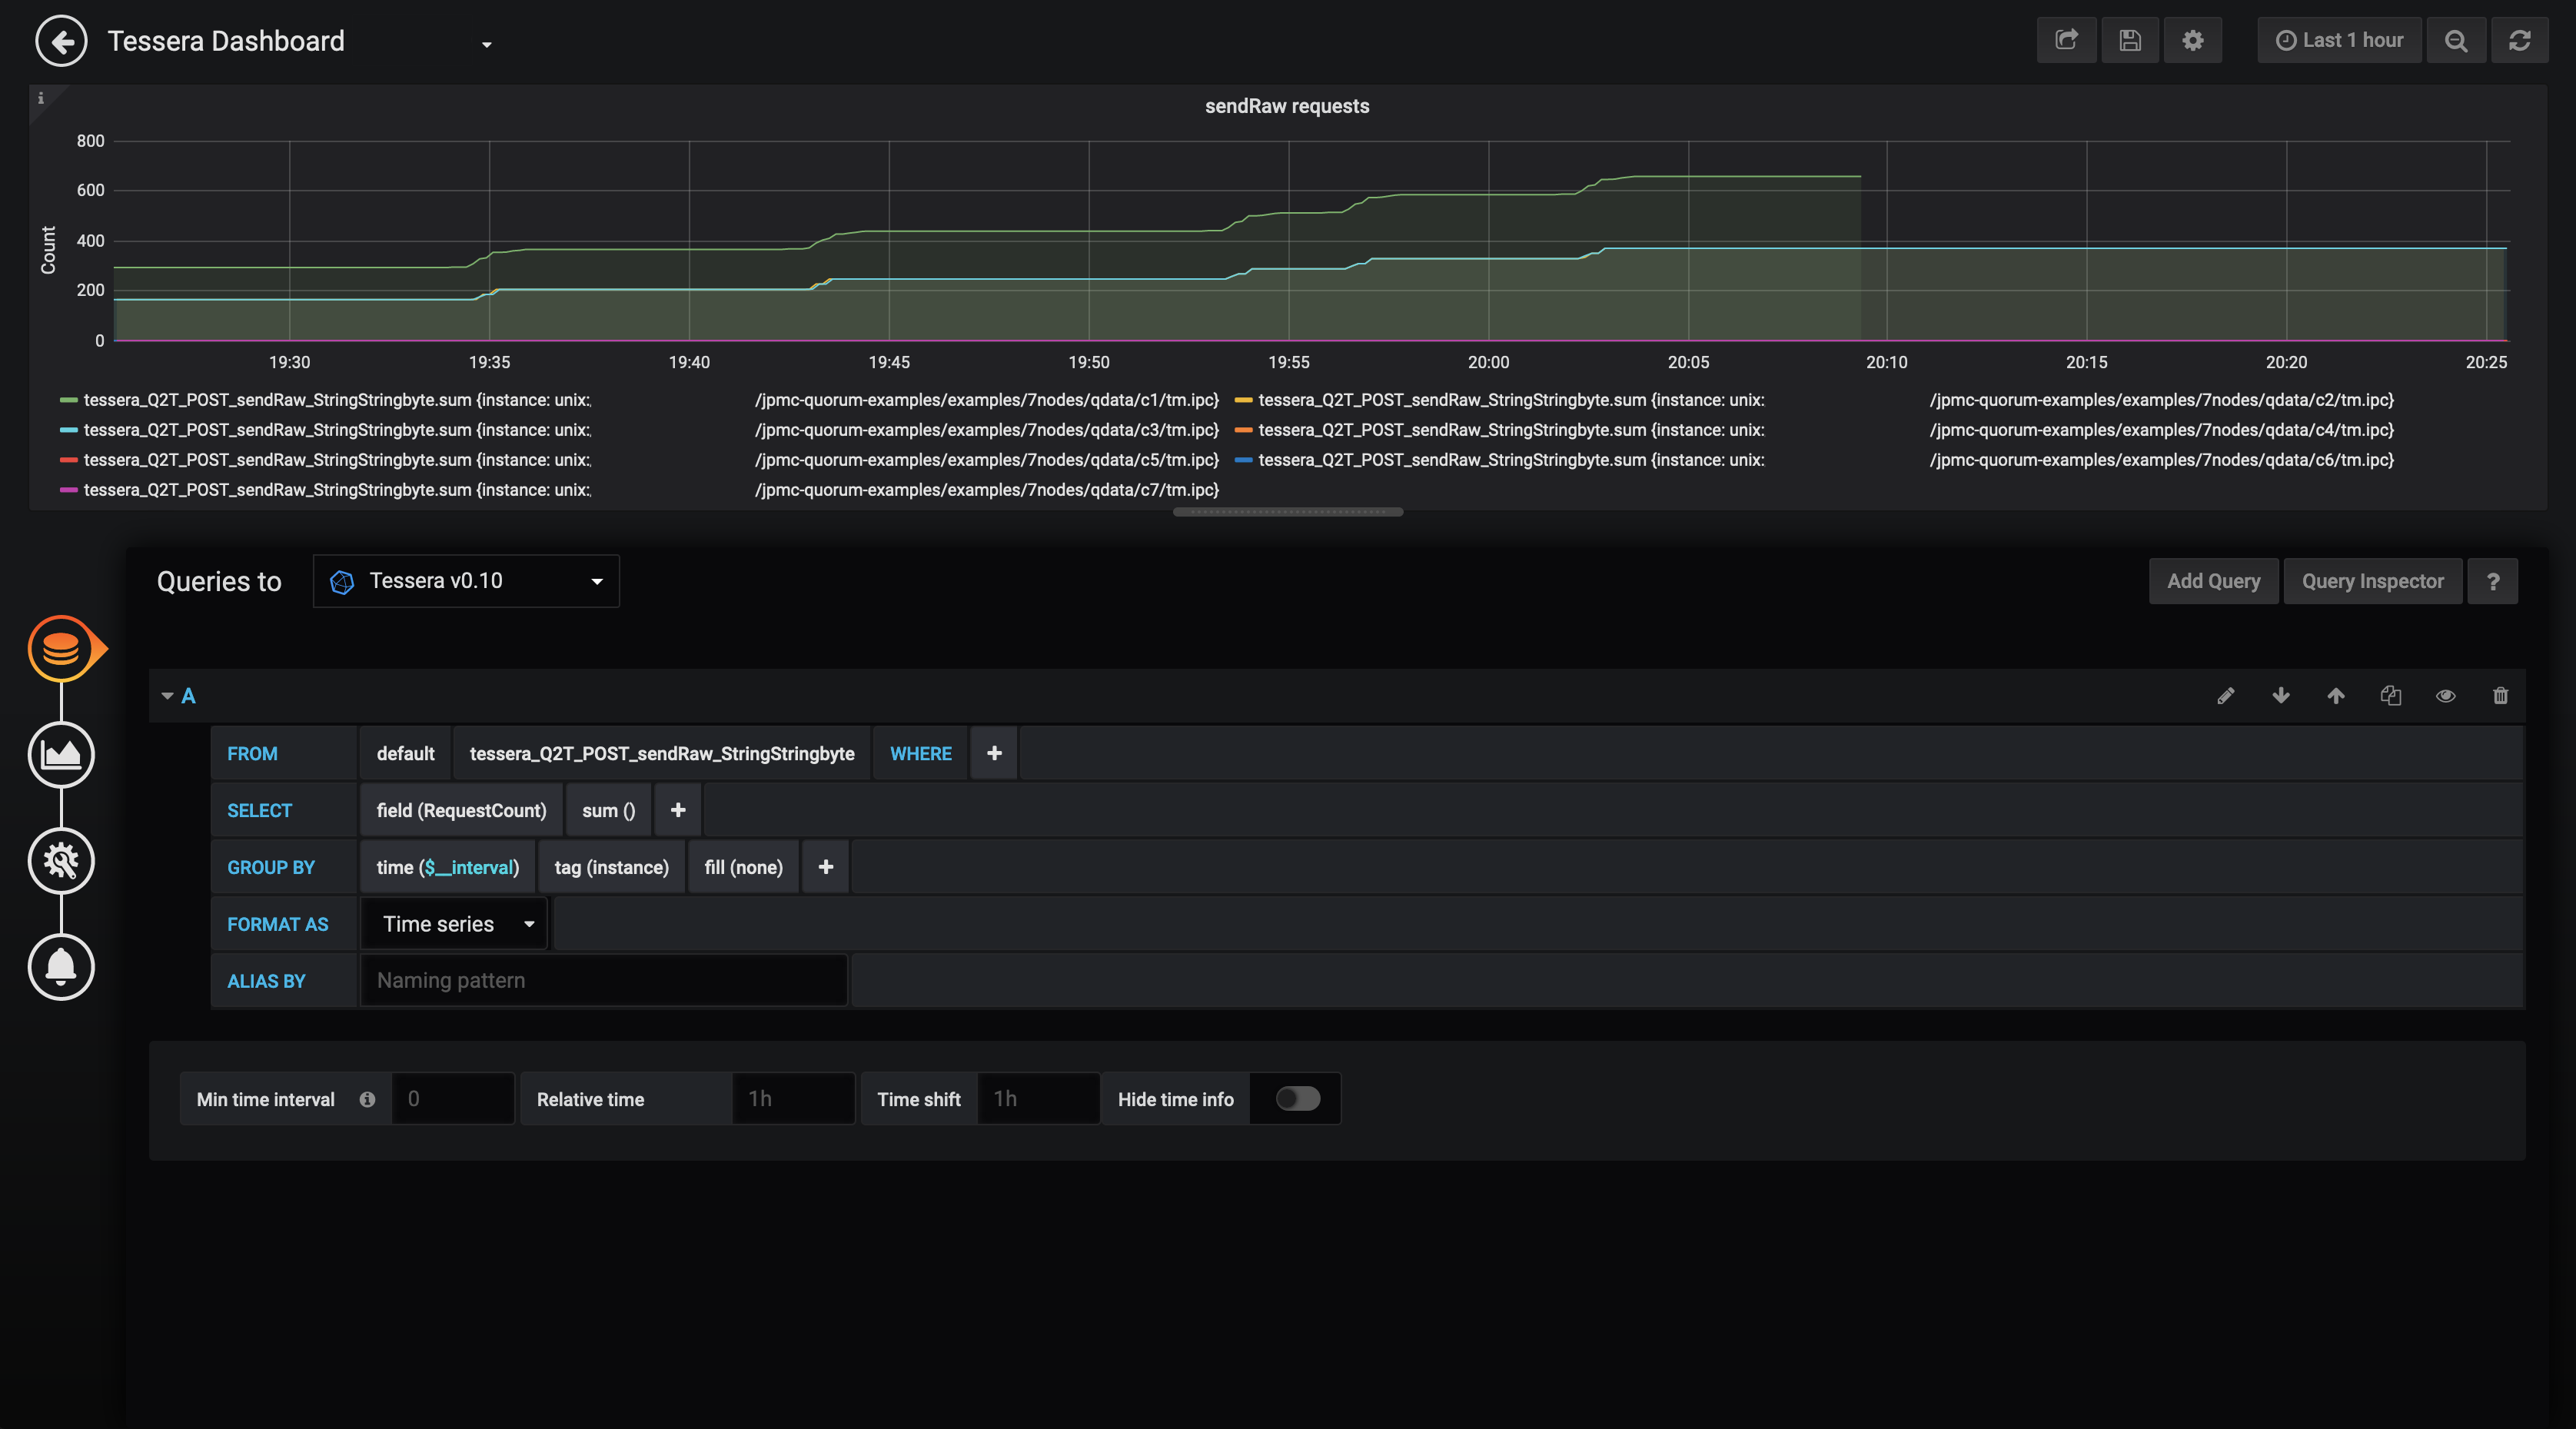
This panel shows the number of private payloads sent to Blackbox using the
sendrawAPI over time.Create receiveRaw requests panel
- Select the correct datasource from the Queries to dropdown list
- Construct the query as shown in the below image. This retrieves the data for the
receiverawAPI from the InfluxDB, finds the sum of theRequestCountfor this data (i.e. the total number of requests) and groups byinstance(i.e. each Blackbox node).time($_interval)automatically scales the graph resolution for the time range and graph width.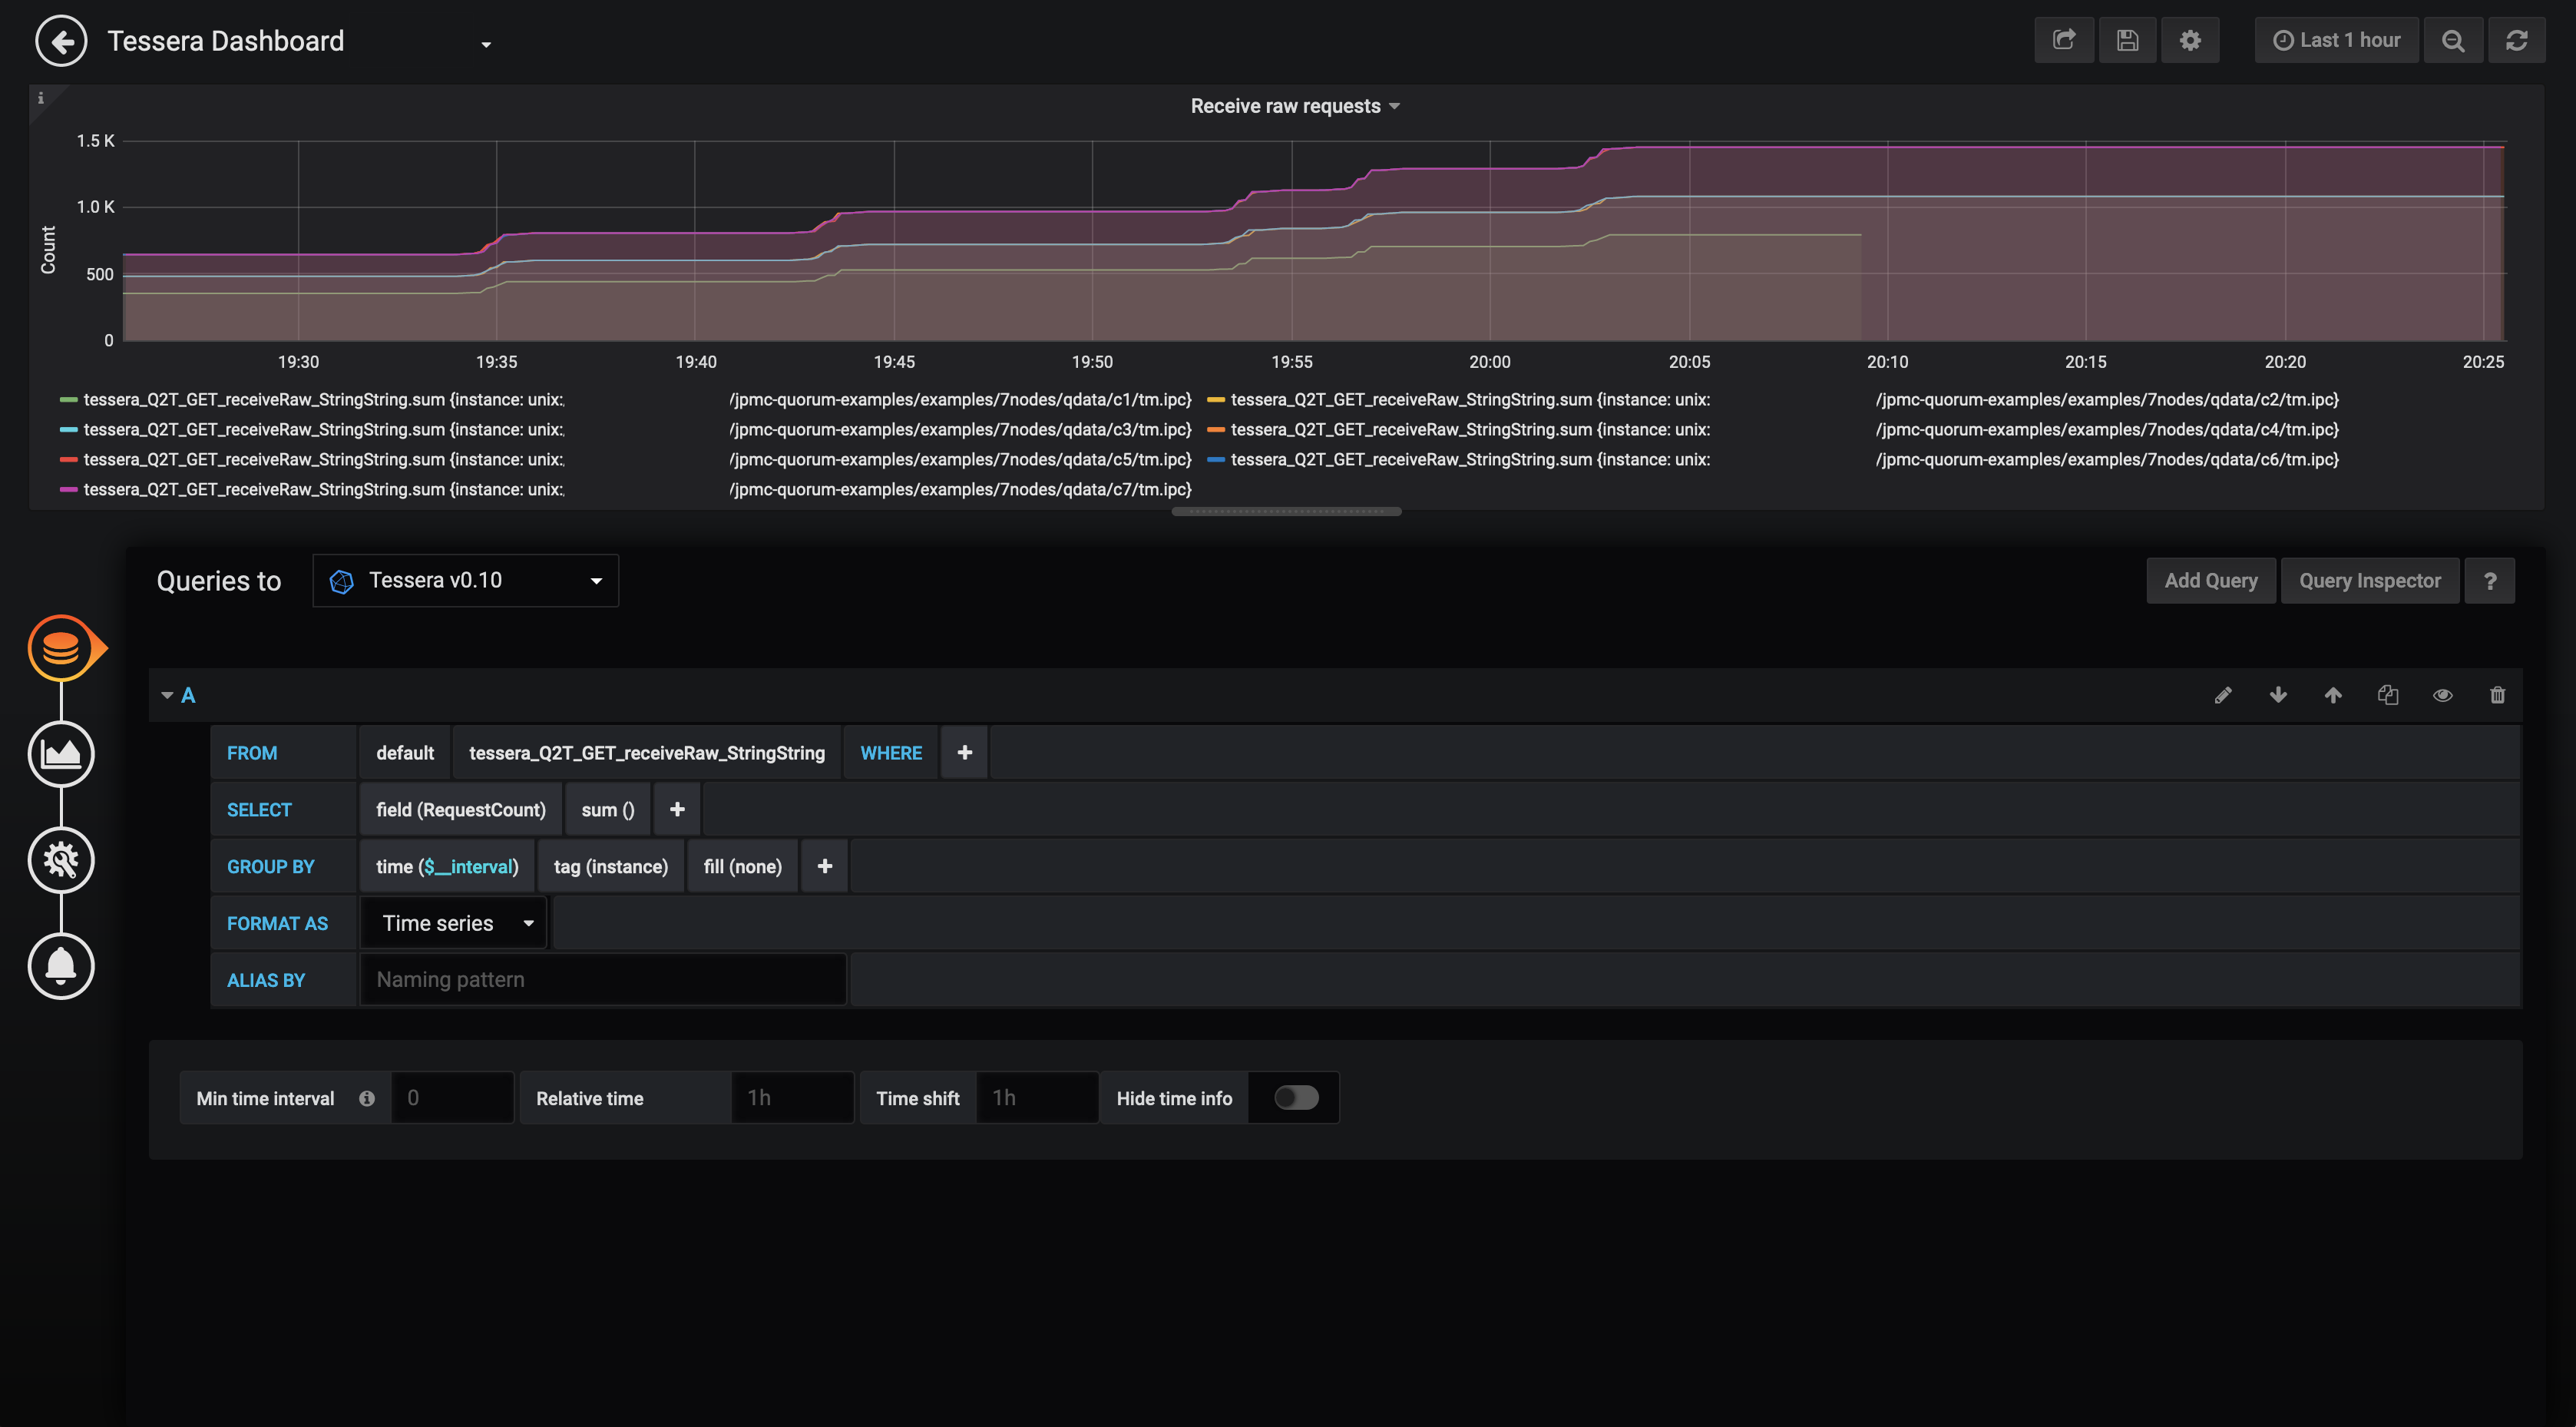
This panel shows the number of private payloads retrieved from Blackbox using the
receiverawAPI over time.Create partyinfo request rate (Blackbox network health) panel
- Select the correct datasource from the Queries to dropdown list
- Construct the query as shown in the below image. This retrieves the data for the
partyinfoAPI from the InfluxDB, finds the non-negative derivative of theRequestCountfor this data and groups byinstance(i.e. each Blackbox node).non_negative_derivative(1s)calculates the per second change inRequestCountand ignores negative values that will occur if a node is stopped and restarted.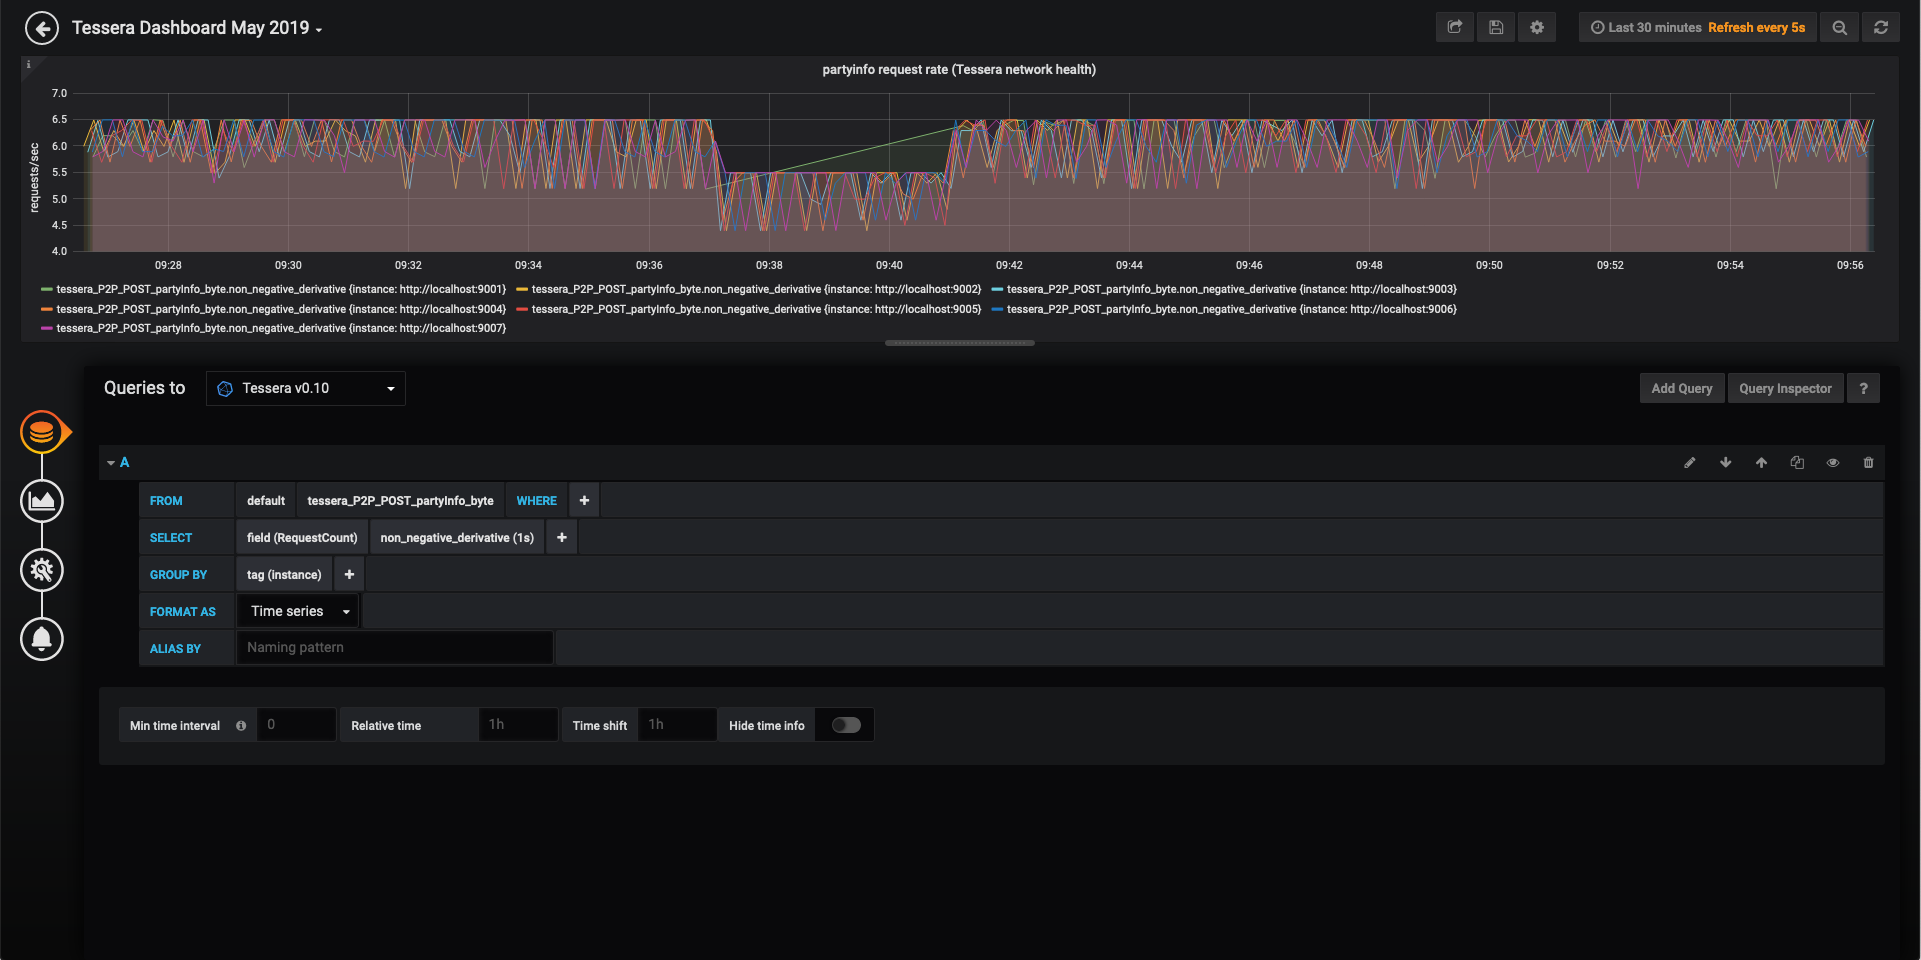
This panel shows the rate of POST requests per second to
partyinfo. For this network of 7 healthy nodes, this rate fluctuates between 5.5 and 6.5 requests/sec. At approx 09:37 node 1 was killed and the partyinfo rate across all nodes immediately drops. This is because they are no longer receiving requests to theirpartyinfoAPI from node 1. At 09:41 node 1 is restarted and the rates return to their original values.This metric can be used as an indirect method of monitoring the health of the network. Using some of the more advanced InfluxDB query options available in Grafana and the other metrics measurements available it may be possible to make this result more explicit.
Alerts and rules can be configured to determine when a node has disconnected and send notifications to pre-configured channels (e.g. Slack, email, etc.).
Create sendRaw rate panel
- Select the correct datasource from the Queries to dropdown list
- Construct the query as shown in the below image. This retrieves the data for the
sendrawAPI from the InfluxDB, finds the sum of theRequestRatefor this data and groups byinstance(i.e. each Blackbox node).time($_interval)automatically scales the graph resolution for the time range and graph width.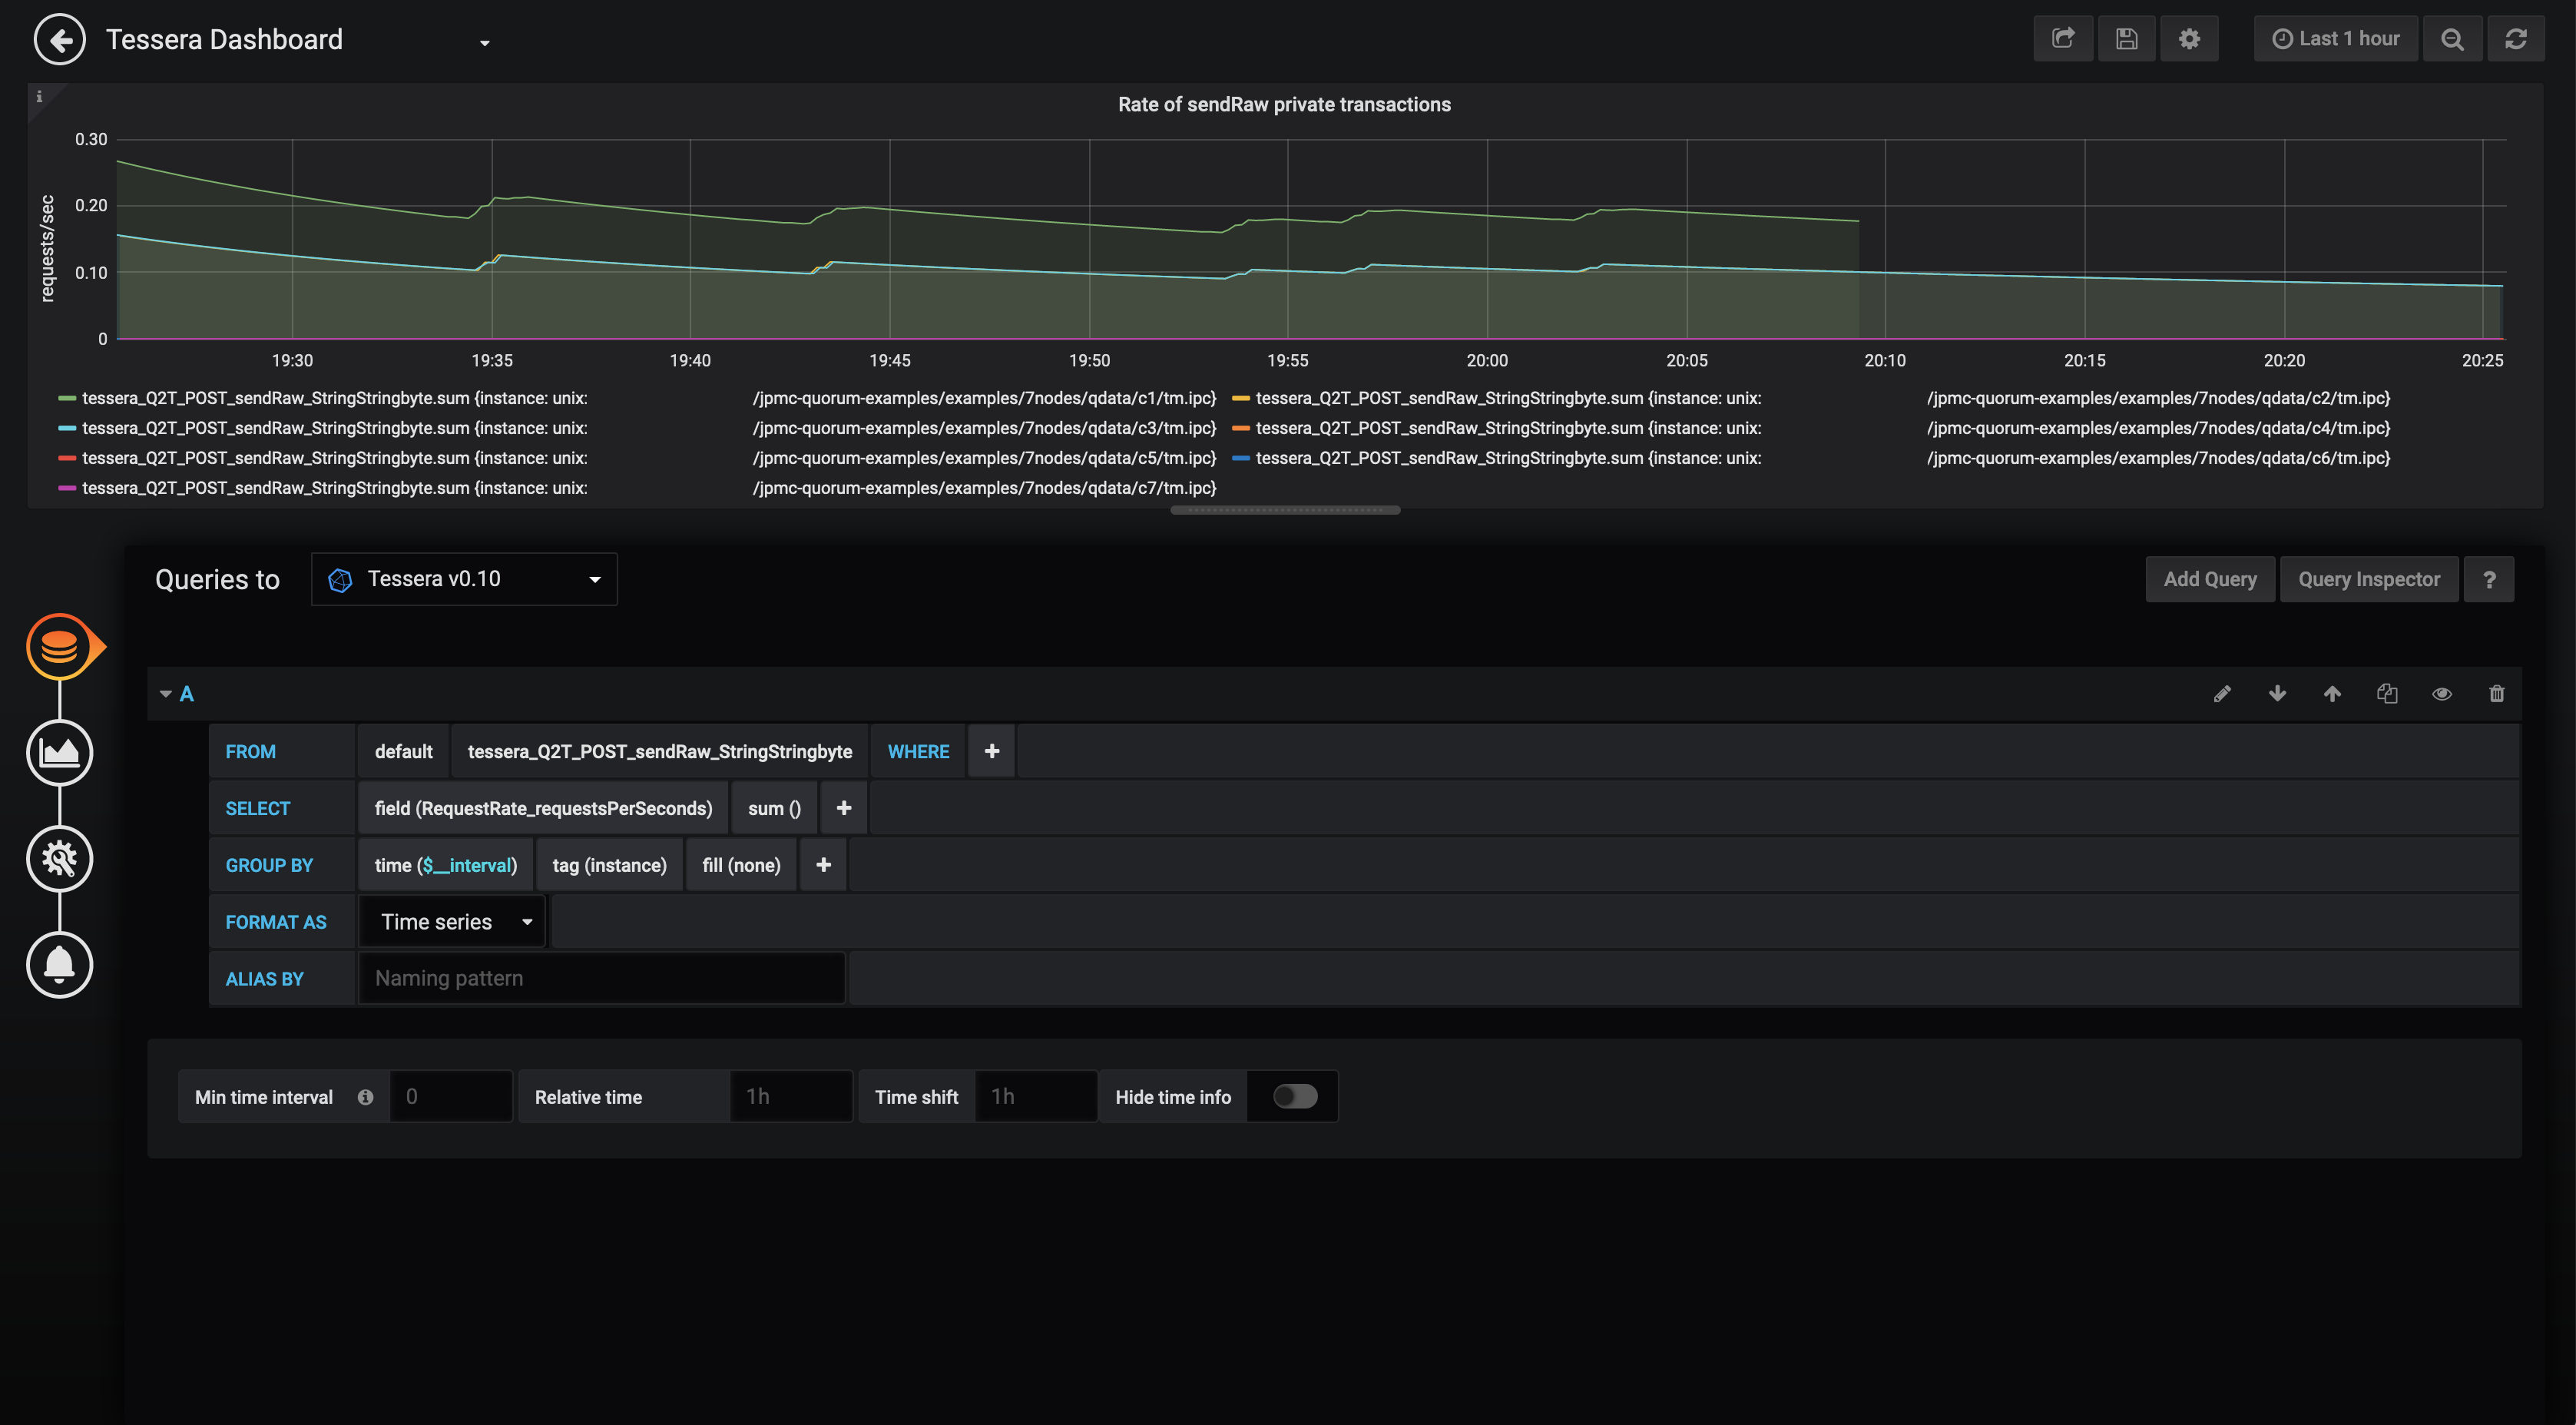
The POST
sendrawAPI is used by Smilo whenever a private transaction is sent using theeth_sendTransactionorpersonal_sendTransactionAPI. This panel gives a good indication of the private tx throughput in Smilo. Note that if thesendrawAPI is called by another process, the count will not be a true representation of Smilo traffic.
Monitoring a Blackbox network with Splunk
Splunk can be used to search, analyze and monitor the logs of Blackbox nodes.
To consolidate the logs from multiple Blackbox nodes in a network requires setting up Splunk and Splunk Universal Forwarders. The following pages from the Splunk documentation are a good starting point for understanding how to achieve this:
- Consolidate data from multiple hosts
- Set up the Universal Forwarder
- Configure the Universal Forwarder
- Enable a receiver
The general steps to consolidate the logs for a Blackbox network in Splunk are:
- Set up a central Splunk instance if one does not already exist. Typically this will be on a separate host to the hosts running the Blackbox nodes. This is known as the Receiver.
- Configure the Blackbox hosts to forward their node's logs to the Receiver by:
Configuring the format and output location of the node's logs. This is achieved by configuring logback (the logging framework used by Blackbox) at node start-up.
The following example XML configures logback to save Blackbox's logs to a file. See the Logback documentation for more information on configuring logback:
<?xml version="1.0" encoding="UTF-8"?>
   <configuration>
       <appender name="FILE" class="ch.qos.logback.core.FileAppender">
           <file>/path/to/file.log</file>
           <encoder>
               <pattern>%d{HH:mm:ss.SSS} [%thread] %-5level %logger{36} - %msg%n</pattern>
           </encoder>
       </appender>
       <logger name="org.glassfish.jersey.internal.inject.Providers" level="ERROR" />
       <logger name="org.hibernate.validator.internal.util.Version" level="ERROR" />
       <logger name="org.hibernate.validator.internal.engine.ConfigurationImpl" level="ERROR" />
       <root level="INFO">
           <appender-ref ref="FILE"/>
       </root>
   </configuration>
To start Blackbox with an XML configuration file:
java -Dlogback.configurationFile=/path/to/logback-config.xml -jar /path/to/Blackbox-app-<version>-app.jar -configfile /path/to/config.jsonSet up Splunk Universal Forwarders (lightweight Splunk clients) on each Blackbox host to forward log data for their node to the Receiver
Set up the Splunk Receiver to listen and receive logging data from the Universal Forwarders

